Streaming Telemetry: Real Time Network Observability
Configuring Nokia SR OS gNMI/gRPC Streaming Telemetry with gNMIc Collector and Prometheus Integration
Introduction
Modern networks generate enormous volumes of operational data every second — interface counters, CPU utilization, BGP session states, MPLS label information, and more. For years, network teams relied on SNMP polling to collect this data, but polling has fundamental limitations: it is slow, CPU-intensive at scale, and blind to events happening between poll cycles.
Streaming telemetry addresses this by reversing the model. Rather than a manager requesting data on a schedule, devices continuously push data whenever values change or at a set interval. This allows for sub-second observability, quicker fault detection, and scalable monitoring architectures.
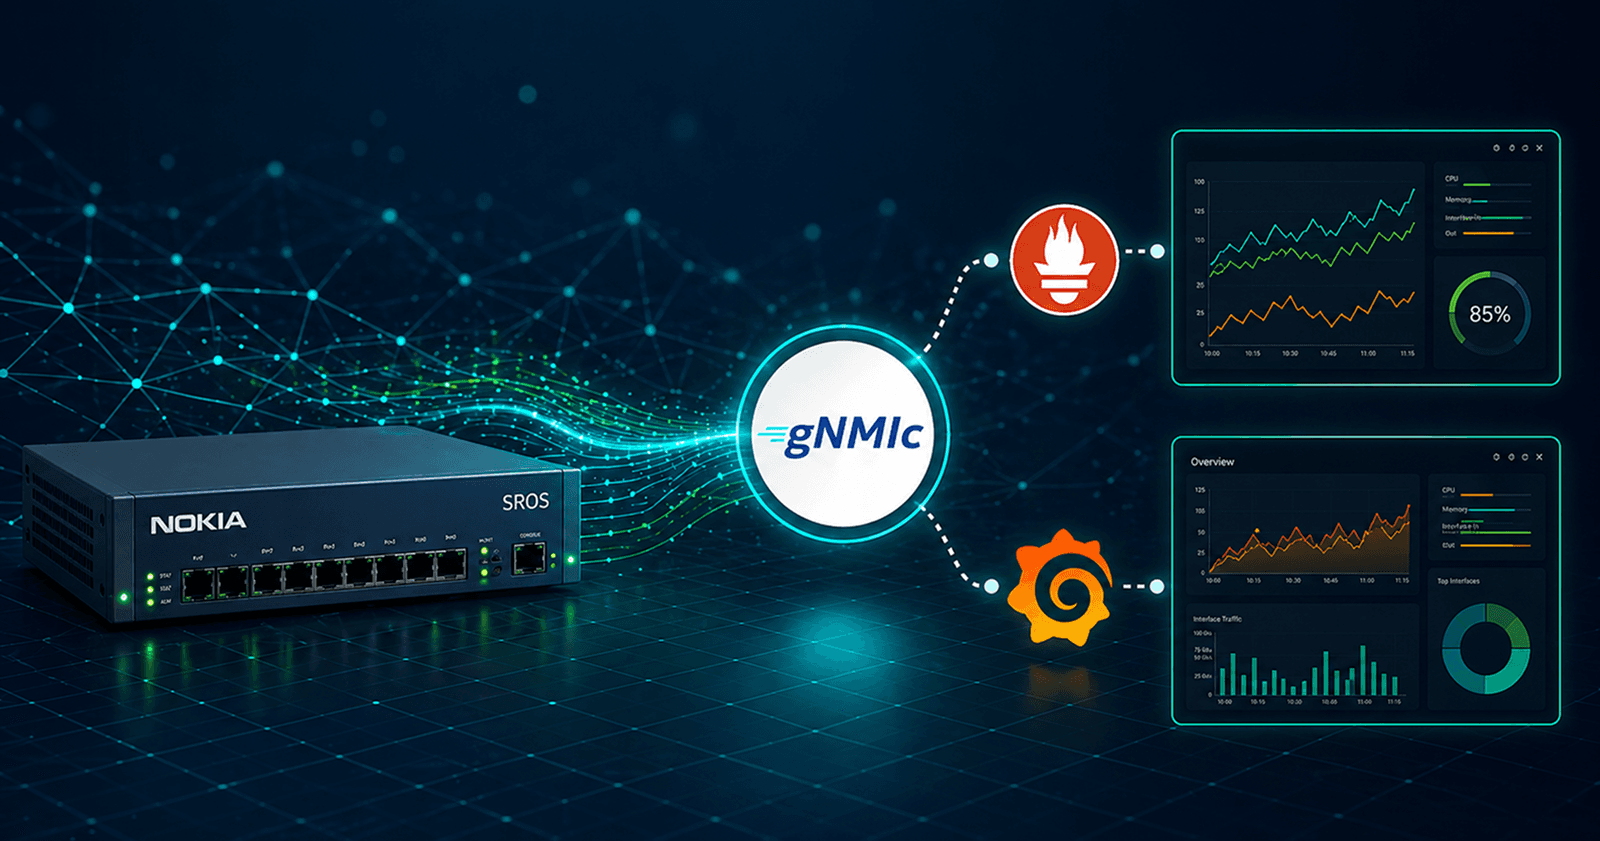
In this post, we guide you through a comprehensive end-to-end setup using Prometheus as the metrics engine. We'll configure streaming telemetry on Nokia SR OS routers, expose it via GNMIC as a Prometheus exporter, scrape and store metrics in Prometheus, and visualize everything using Grafana.
Traditional SNMP vs Streaming Telemetry
Comparison Matrix
| Dimension | SNMP (Traditional) | gNMI Streaming |
|---|---|---|
| Collection Model | Poll-based (pull) : manager request data | Push-based : client streams data |
| Transport | UDP (v2c) or TCP (v3) | gRPC over HTTP/2 + TLS |
| Typical interval | 5–15 minutes | 1–10 seconds (or ON_CHANGE) |
| Fault detection | Up to one full poll cycle | Sub-second in ON_CHANGE mode |
| Security | SNMPv2c: community string (plaintext) or SNMPv3 via hashing and encryption | mTLS, token auth, RBAC |
| Data Modelling | MIB-based , vendor fragmented | YANG-based, standards-aligned |
| Encoding | ASN.1 (Abstract Syntax Notation) with Basic Encodin Rules (BER) | JSON_IETF, PROTObuf, BYTES |
gRPC Protocol
gRPC (general-purpose Remote Procedure Call) is a modern, open-source, high-performance framework for Remote Procedure Calls (RPC).
gRPC was originally developed by Google, which had been using a general-purpose RPC infrastructure called Stubby to connect its numerous microservices across data centers for over a decade. In March 2015, Google decided to create the next iteration of Stubby and release it as open source. This led to the development of gRPC, now widely adopted by various organizations to support applications ranging from microservices to the "last mile" of computing, including mobile, web, and Internet of Things.
In Nokia SR OS, this framework is used to implement the gRPC server, which can then be used for configuration management or telemetry. The gRPC transport service uses HTTP/2 bidirectional streaming between the gRPC client (the data collector) and the gRPC server (the SR OS device). A gRPC session is a single connection from the gRPC client to the gRPC server over a TCP or TLS port. The gRPC service runs on port 57400 by default.

Protocol Stack
Transport Layer Security (TLS)
The gRPC server on the SR OS can operate in the following modes:
• without TLS encryption
• with TLS encryption
Enabling TLS encryption enhances security. Without it, gRPC messages are transmitted unencrypted, making usernames and passwords visible if packets are intercepted. In general, only server-side authentication is used, however, TLS does allow this to be extended to two-way authentication where the client certificate is also authenticated.
gNMI Service
gNMI (gRPC Network Management Interface) is a unified management protocol for streaming telemetry and configuration management, utilizing the open-source gRPC framework. It is an initiative of the OpenConfig consortium, a group of network operators led by Google. Nokia SR OS supports both OpenConfig and Nokia-native YANG models.
gNMI Operations
| RPC | Description |
|---|---|
| Capability | Retrieve the set of capabilities that is supported by the server. This allows the client to validate the service version that is implemented and retrieve the set of models that the server supports |
| Get/Set | Information is retrieved from the NE using GET RPC messages, which consist of ‟GetRequest” and ‟GetResponse” messages. With Set, the data state on the server is modified. The paths to be changed, along with the new values the client wants to apply, are specified. |
| Subscribe | The gRPC client initiates a subscription by sending a subscribe RPC that contains a "SubscribeRequest" message to the gRPC server. The subscription contains one or more paths detailing the required data, together with a specified subscription mode |
| Publish | With dial-out telemetry, where the Nokia SR OS node is the gRPC client instead of the gRPC server, the SR OS node sends a Publish RPC with a ‟SubscribeResponse” message to the gRPC server |
gRPC Telemetry Sessions
gRPC telemetry sessions can be initiated using Dial-in and Dial-out modes
Dial-in Telemetry
When the data collector starts the gRPC connection, the Nokia SR OS node acts as the gRPC server, and the collector becomes the client. This is known as dial-in telemetry, where the Nokia SR OS node pushes data to the collector.

Telemetry Dial-in : Dynamic Subscriptions
Dial-Out Telemetry
When the Nokia SR OS node initiates the gRPC connection, the Nokia SR OS node assumes the role of the gRPC client. This is referred to as dial-out telemetry.

Telemetry Dial-out: Persistent Subscriptions
Using gNMIc with Nokia SR OS
gNMIc : is a gNMI CLI client that provides full support for Capabilities, Get, Set and Subscribe RPCs with collector capabilities. Developed and maintained by Nokia.

gRPC Nokia SR OS server
# enable model-driven mode

configure system management-interface configuration-mode model-driven

# select user and permissions

[gl:/configure system security user-params local-user user "admin"]
access {
        grpc true
    }
    console {
        member ["administrative"]
    }

# Enable unsecured gRPC

[gl:/configure system grpc]
    admin-state enable
    allow-unsecure-connection
    rib-api {
        admin-state enable
    }
gNMIc Install
# To download & install the latest release the following automated installation script can be used

bash -c "$(curl -sL https://get-gnmic.openconfig.net)"

# Check the version

gnmic version
version : 0.45.0
 commit : d461eac0
   date : 2026-03-03T23:37:56Z
 gitURL : https://github.com/openconfig/gnmic
   docs : https://gnmic.openconfig.net
Using gNMI services
The following section offers practical examples of using gNMIc for gNMI operations. User documentation is available at gnmic.openconfig.net . It is well-structured and maintained, as well as easy to use.
Capabilities RPC
The simplest gNMI operation is the Capabilities RPC, which involves a Capability Request initiated by the client, followed by a Capability Response from the gRPC server detailing the supported gNMI version, YANG models, and gRPC encodings
gnmic -a 172.20.20.13:57400 -u admin -p codeNetwk@123! --insecure capabilities

gNMI version: 0.8.0
supported models:
  - nokia-conf, Nokia, 24.10.R5
  - nokia-state, Nokia, 24.10.R5
  - nokia-li-state, Nokia, 24.10.R5
  - nokia-sr-openconfig-aaa-augments, Nokia, 24.10.R5
  - nokia-sr-openconfig-dev-examples-augments, Nokia, 24.10.R5
  - nokia-sr-openconfig-if-ethernet-augments, Nokia, 24.10.R5
  - nokia-sr-openconfig-if-ip-augments, Nokia, 24.10.R5
  - nokia-sr-openconfig-mpls-augments, Nokia, 24.10.R5
  - nokia-sr-openconfig-system-terminal-deviations, Nokia, 24.10.R5
  - nokia-sr-openconfig-telemetry-deviations, Nokia, 24.10.R5
  - nokia-sr-openconfig-terminal-device-deviations, Nokia, 24.10.R5
  - nokia-sr-openconfig-vlan-deviations, Nokia, 24.10.R5
supported encodings:
  - JSON
  - BYTES
  - PROTO
  - JSON_IETF

................... [ Truncated Output ]
Get RPC
The Get RPC provides a mechanism for a client to request config or state data for a path or set of paths and for it to be returned by the target node
gnmic -a 172.20.20.13:57400 -u admin -p codeNetwk@123! --insecure \
      get --path /state/system/platform

[
  {
    "source": "172.20.20.13:57400",
    "timestamp": 1777325450020727215,
    "time": "2026-04-28T09:30:50.020727215+12:00",
    "updates": [
      {
        "Path": "state/system/platform",
        "values": {
          "state/system/platform": "7750 SR-1"
        }
      }
    ]
  }
]
Set RPC
The Set RPC is intended to allow for modifications to the configuration state of the target node .
gNMIc allows the user to execute Set RPCs for the update operation using in-line updates where the path and intended modifications are entered on the command line --update-value
gnmic --config configs/config.yml set --update-path /configure/port[port-id=1/1/c1/1]/description --update-value gnmictest

2026/04/28 09:38:31.296832 [gnmic] version=0.45.0, commit=d461eac0, date=2026-03-03T23:37:56Z, gitURL=https://github.com/openconfig/gnmic, docs=https://gnmic.openconfig.net
2026/04/28 09:38:31.296873 [gnmic] using config file "configs/config.yml"
2026/04/28 09:38:31.297023 [gnmic] adding target {"name":"172.20.20.13:57400","address":"172.20.20.13:57400","username":"admin","password":"****","timeout":10000000000,"insecure":true,"skip-verify":false,"buffer-size":100,"retry-timer":10000000000,"log-tls-secret":false,"gzip":false,"token":""}
2026/04/28 09:38:31.297280 [gnmic] sending gNMI SetRequest: prefix='<nil>', delete='[]', replace='[]', update='[path:{elem:{name:"configure"}  elem:{name:"port"  key:{key:"port-id"  value:"1/1/c1/1"}}  elem:{name:"description"}}  val:{json_ietf_val:"\"gnmictest\""}]', extension='[]' to 172.20.20.13:57400
2026/04/28 09:38:31.297683 [gnmic] creating gRPC client for target "172.20.20.13:57400"
{
  "source": "172.20.20.13:57400",
  "timestamp": 1777325911161749222,
  "time": "2026-04-28T09:38:31.161749222+12:00",
  "results": [
    {
      "operation": "UPDATE",
      "path": "configure/port[port-id=1/1/c1/1]/description"
    }
  ]
}

# check the configured port in Nokia SROS
[gl:/configure port 1/1/c1/1]
 admin-state enable
    description "gnmictest"
    ethernet {
        lldp {
            dest-mac nearest-bridge {
                notification true
                receive true
                transmit true
                tx-tlvs {
                    port-desc true
                    sys-name true
                    sys-desc true
                }
            }
        }
    }
config.yml file with logging enabled, along with the node IP information and credentials.Subscribe RPC
When a client wants to receive specific state data, it initiates a subscription using the Subscribe RPC. This subscription includes one or more paths outlining the desired data, along with a chosen subscription mode. There are three modes that determine the duration of the subscription:
ONCE: specifies a subscription that provides data as a one-time response
POLL: is a subscription that uses a stream to periodically request data
STREAM: is a continuous subscription that streams data based on triggers defined by the subscription mode. This mode can be
ON_CHANGE,SAMPLE, orTARGET_DEFINED
ONCE
A subscription operating in the ONCE mode dictates a single request/response exchange
gnmic -a 172.20.20.13:57400 -u admin -p codeNetwk@123! --insecure \
      sub --path "/state/system/memory-pools/summary" -- mode once

{
  "source": "172.20.20.13:57400",
  "subscription-name": "default-1777327406",
  "timestamp": 1777327406422019039,
  "time": "2026-04-28T10:03:26.422019039+12:00",
  "prefix": "state/system/memory-pools/summary",
  "updates": [
    {
      "Path": "current-total-size",
      "values": {
        "current-total-size": "2095054848"
      }
    },
    {
      "Path": "total-in-use",
      "values": {
        "total-in-use": "1898836352"
      }
    },
    {
      "Path": "available-memory",
      "values": {
        "available-memory": "1720713216"
      }
    }
  ]
}
{
  "sync-response": true
}
STREAM
Stream subscriptions are long-lived subscriptions which continue to transmit updates at the requested sample interval for the set of paths within the Subscribe Request indefinitely
gnmic -a 172.20.20.13:57400 -u admin -p codeNetwk@123! --insecure \
      sub --path "/state/port[port-id=1/1/c1/1]/statistics/in-packets" -- sample-interval 10s

{
  "source": "172.20.20.13:57400",
  "subscription-name": "default-1777327689",
  "timestamp": 1777327689262295519,
  "time": "2026-04-28T10:08:09.262295519+12:00",
  "prefix": "state/port[port-id=1/1/c1/1]/statistics",
  "updates": [
    {
      "Path": "in-packets",
      "values": {
        "in-packets": "14376890"
      }
    }
  ]
}
{
  "sync-response": true
}
{
  "source": "172.20.20.13:57400",
  "subscription-name": "default-1777327689",
  "timestamp": 1777327699260018112,
  "time": "2026-04-28T10:08:19.260018112+12:00",
  "prefix": "state/port[port-id=1/1/c1/1]/statistics",
  "updates": [
    {
      "Path": "in-packets",
      "values": {
        "in-packets": "14376916"
      }
    }
  ]
}
{
  "source": "172.20.20.13:57400",
  "subscription-name": "default-1777327689",
  "timestamp": 1777327709259895901,
  "time": "2026-04-28T10:08:29.259895901+12:00",
  "prefix": "state/port[port-id=1/1/c1/1]/statistics",
  "updates": [
    {
      "Path": "in-packets",
      "values": {
        "in-packets": "14376945"
      }
    }
  ]
}
Dial-out Telemetry
In general, the SR-OS node performs the role of a gRPC server responding to subscription requests from a gRPC client. However, it is possible for the SR-OS to perform the role of gRPC client, initiating gRPC connections and pushing data to a gRPC server using a Publish RPC. This is referred to as dial-out telemetry
Dial-out subscriptions are configured on the router and are persistent. The configuration is defined with three constituent parts;
A sensor group to define one or more schema paths to stream
A destination group specifying the destination address(es) and ports that the router uses to send telemetry data.
Persistent subscriptions to associate a sensor group with a destination group
The following shows an example of the SR-OS configuration for dial-out telemetry.
system {
        telemetry {
            destination-group "dialout" {
                allow-unsecure-connection
                destination 172.31.255.29 port 57400 {
                    router-instance "Base"
                }
            }
            persistent-subscriptions {
                subscription "dialout" {
                    admin-state enable
                    sensor-group "port-stats"
                    mode sample
                    destination-group "dialout"
                    encoding bytes
                }
            }
            sensor-groups {
                sensor-group "port-stats" {
                    path "/state/port[port-id=1/1/c1/1]/statistics/out-octets" { }
                }
            }
        }
	}

A:admin@PE1# /show system telemetry persistent subscription "dialout"

===============================================================
Telemetry persistent subscription
===============================================================
Subscription Name     : dialout
Administrative State  : Enabled
Operational State     : Up
Subscription Id       : 65
Description           : (Not Specified)
Sensor Group          : port-stats
Destination Group     : dialout
Path Mode             : sample
Sample Interval       : 10000 ms
Encoding              : json-ietf
===============================================================
Setup gNMIc
To make gNMIc simulate a gRPC server, use the listen argument along with an IP address and port to receive publish subscriptions.
gnmic listen -a 172.31.255.29:57400 --insecure
{
  "source": "172.20.20.13:58158",
  "system-name": "PE1",
  "subscription-name": "dialout",
  "timestamp": 1777328434091359417,
  "time": "2026-04-28T10:20:34.091359417+12:00",
  "prefix": "state/port[port-id=1/1/c1/1]/statistics",
  "updates": [
    {
      "Path": "out-octets",
      "values": {
        "out-octets": "5521927017"
      }
    }
  ]
}
{
  "source": "172.20.20.13:58158",
  "system-name": "PE1",
  "subscription-name": "dialout",
  "timestamp": 1777328444090433719,
  "time": "2026-04-28T10:20:44.090433719+12:00",
  "prefix": "state/port[port-id=1/1/c1/1]/statistics",
  "updates": [
    {
      "Path": "out-octets",
      "values": {
        "out-octets": "5521939044"
      }
    }
  ]
}
The GPG Stack Architecture
The GPG Stack (GNMIC · Prometheus · Grafana) serves as a cloud-native observability pipeline for network telemetry. GNMIC connects the gNMI push model with Prometheus's pull-based scrape model.

Telemetry Stack
GNMIC Config — Prometheus Output Mode
subscriptions:
  port_stats_nokia:
    paths:
      - "/state/port[port-id=*]/statistics/in-packets"
      - "/state/port[port-id=*]/statistics/out-packets"
      - "/state/port[port-id=*]/statistics/in-octets"
      - "/state/port[port-id=*]/statistics/out-octets"
    mode: stream
    stream-mode: sample
    sample-interval: 10s
    encoding: json_ietf
  service_state:
    paths:
      - "/state/service/vprn[service-name=*]/oper-state"
    mode: once
  system_facts:
    paths:
      - "configure/system/name"
      - "state/system/version"
    mode: once
  system_resources:
    paths:
      - "/state/system/memory-pools/summary"
      - "/state/system/cpu[sample-period=60]/summary"
    mode: stream
    stream-mode: sample
    sample-interval: 10s
    encoding: json_ietf
targets:
      172.20.20.13:

outputs:
  prometheus-out:
    type: prometheus
    listen: ":9804"
    path: /metrics
    expiration: 10m
    metric-prefix: sros_
Run gNMIc
gnmic --config configs/subscriptions.yml sub --name port_stats_nokia

# Confirm if metrics are being exposed to Prometheus
curl http://localhost:9804/metrics | head -20
sros__state_port_statistics_in_octets{port_port_id="1/1/c1",source="172.20.20.13",subscription_name="port_stats_nokia"} 0
sros__state_port_statistics_in_octets{port_port_id="1/1/c1/1",source="172.20.20.13",subscription_name="port_stats_nokia"} 5.510908681e+09
sros__state_port_statistics_in_octets{port_port_id="1/1/c2/1",source="172.20.20.13",subscription_name="port_stats_nokia"} 8.342930752e+09
sros__state_port_statistics_in_octets{port_port_id="1/1/c3/1",source="172.20.20.13",subscription_name="port_stats_nokia"} 149554
Prometheus Configuration
Install Prometheus
prometheus.yml
global:
  scrape_interval: 15s

scrape_configs:
  - job_name: 'gnmic'
    static_configs:
      - targets: ['localhost:9804']
Access Prometheus
http://localhost:9090

#If running on a VM (like your Rocky Linux setup)
http://<VM-IP>:9090
Test Metrics in Prometheus

sros_state_port_statistics are accessible in Prometheus
Grafana Configuration
Install Grafana
Access Grafana
http://<your-ip>:3000
Username:
adminPassword:
admin
Add Prometheus to Grafana
In Grafana:
Go to Settings → Data Sources
Add Prometheus
URL:
http://<your-host-ip>:9090
Build Your First Dashboard
Here's a basic dashboard I've created, named "Nokia SR OS Port Telemetry" using a simple PromQL query: rate(sros__state_port_statistics_in_octets[5m]) * 8, which measures bits per second.

Conclusion
Streaming telemetry is transforming the way modern networks are monitored and operated. Unlike traditional polling methods such as SNMP, telemetry provides continuous, near real-time visibility into device performance, interface utilization, routing behavior, and system health. This shift allows network engineers to move from reactive troubleshooting to proactive operations.
By combining gnmic, Prometheus, and Grafana, organizations can build a scalable observability platform capable of collecting high-frequency metrics and converting them into meaningful dashboards, alerts, and operational insights. Whether monitoring a single Nokia SR OS router or a multi-vendor backbone, telemetry enables faster fault detection, capacity planning, and service assurance.
For network automation teams, streaming telemetry is more than a monitoring tool—it is a foundation for closed-loop automation, where network state can automatically trigger intelligent actions. As networks continue to grow in speed, complexity, and business importance, telemetry becomes essential rather than optional.